Here’s a simplified Copper Production Flow Chart from mining to refined copper:
.jpg) 1. Mining
1. Mining
– Open-pit or Underground Mining.jpg) → Extract copper ore (typically 0.5–2% Cu).
→ Extract copper ore (typically 0.5–2% Cu).
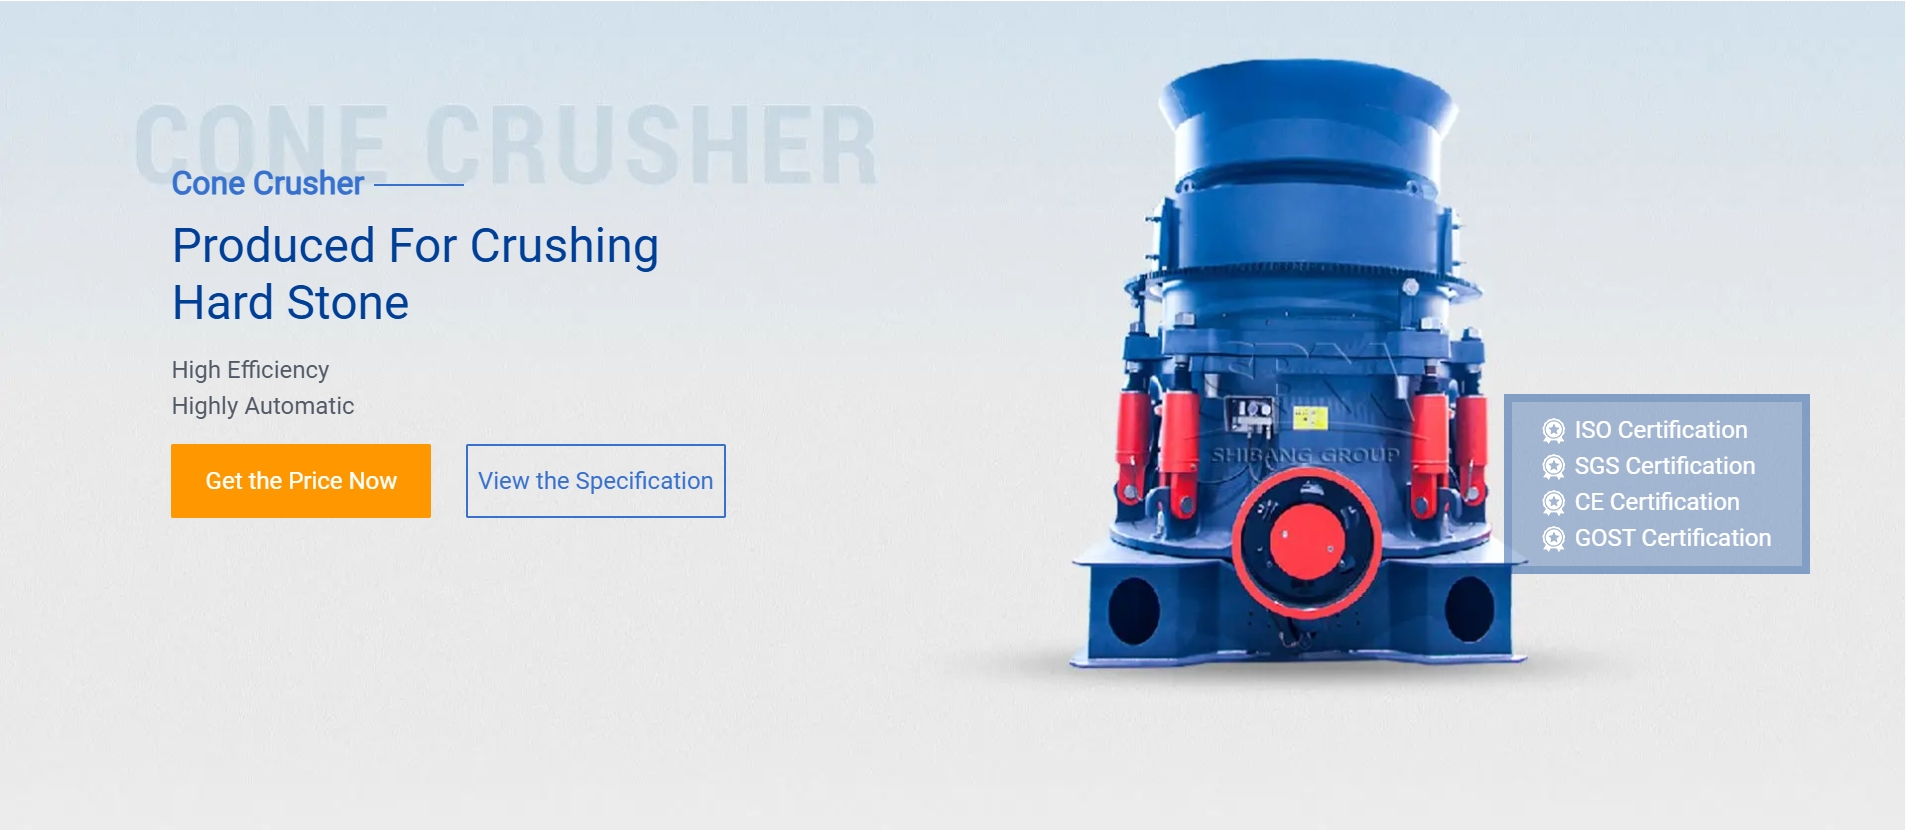
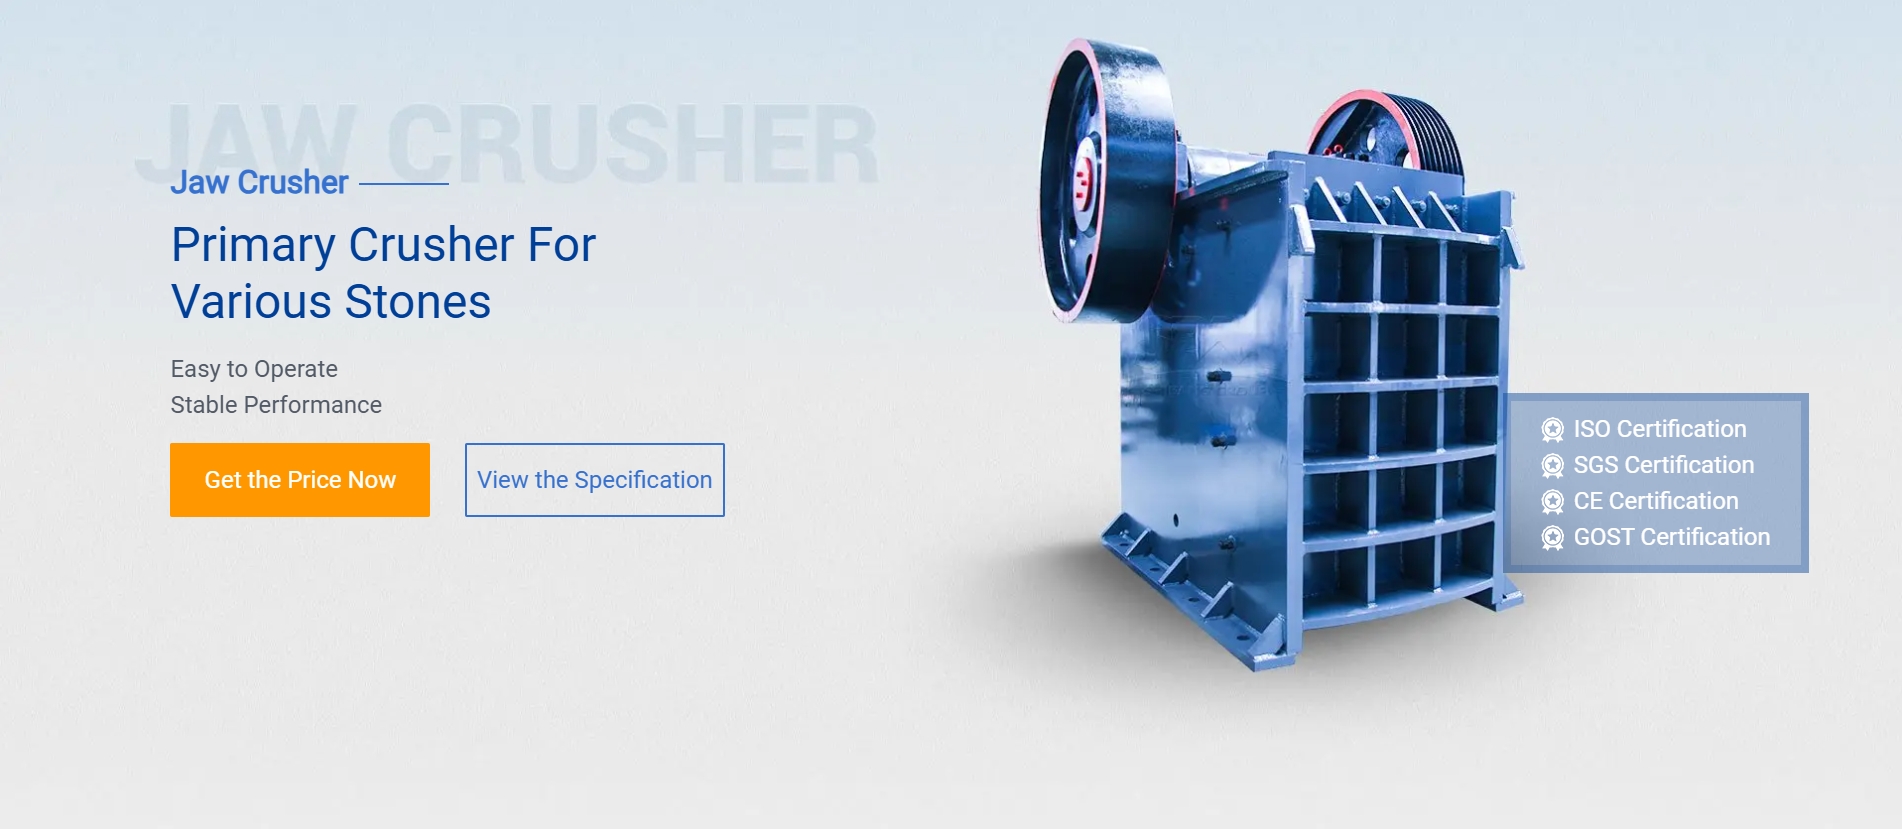
2. Crushing & Grinding
– Ore is crushed into small pieces → Ground into fine powder.
3. Froth Flotation (Concentration)
– Mixed with water & chemicals → Air bubbles float copper minerals.
– Output: Copper concentrate (~20–30% Cu).
4. Smelting
– Concentrate is heated in a furnace (e.g., flash smelting).
– Impurities form slag (removed).
– Output: Matte (~50–70% Cu) → Blister Copper (~98–99% Cu).
5. Electrorefining (for Pure Copper)
– Blister copper cast into anodes → Placed in electrolytic cells.
– Pure copper (~99.99% Cu) deposits on cathodes.
6. Final Products
– Cathodes → Melted & shaped into wires, rods, sheets, etc.
—
Alternative: Hydrometallurgy (for Oxide Ores)
1. Leaching: Sulfuric acid dissolves copper from ore.
2. Solvent Extraction (SX): Separates copper from solution.
3. Electrowinning (EW): Electrically plates pure copper onto cathodes.
—
Would you like a more detailed version for a specific stage?


